
GeoMundo: Automated detection of deforestation from satellite images

Gemundo creates a binary output image with the forested pixels in white and deforested pixels in black
During my work in Lima Peru for Amazon Conservation I had the opportunity to work with their sister organization Conservación Amazónica on the joint project called Monitoring the Andean Amazon Project (MAAP). Working on MAAP was a highly rewarding and educational experience.
The goal of my project was simple.: create a tool that could be utilized by staff to easily segment deforested from forested segments of satellite images. The goal was to reduce the amount of time and energy spent by GIS technicians to hand digitize each satellite image. In order to achieve this goal we used an open-source project called OrfeoToolbox for state-of-the-art remote sensing and satellite image processing.
Geomundo was developed to be used as a way to not only automatically detect deforestation but was also developed to quickly manipulate batches of satellite images. Users can treat a set of different images all with the same instructions or can generate a range of instructions to be carried out on copies of the same image. This gives the remote sensing technician an easy way to add, remove and manipulate many satellite images and image layers with minimal work.
I was also able to design Geomundo to automatically detect illegal gold mining operations in the Peruvian Amazon.
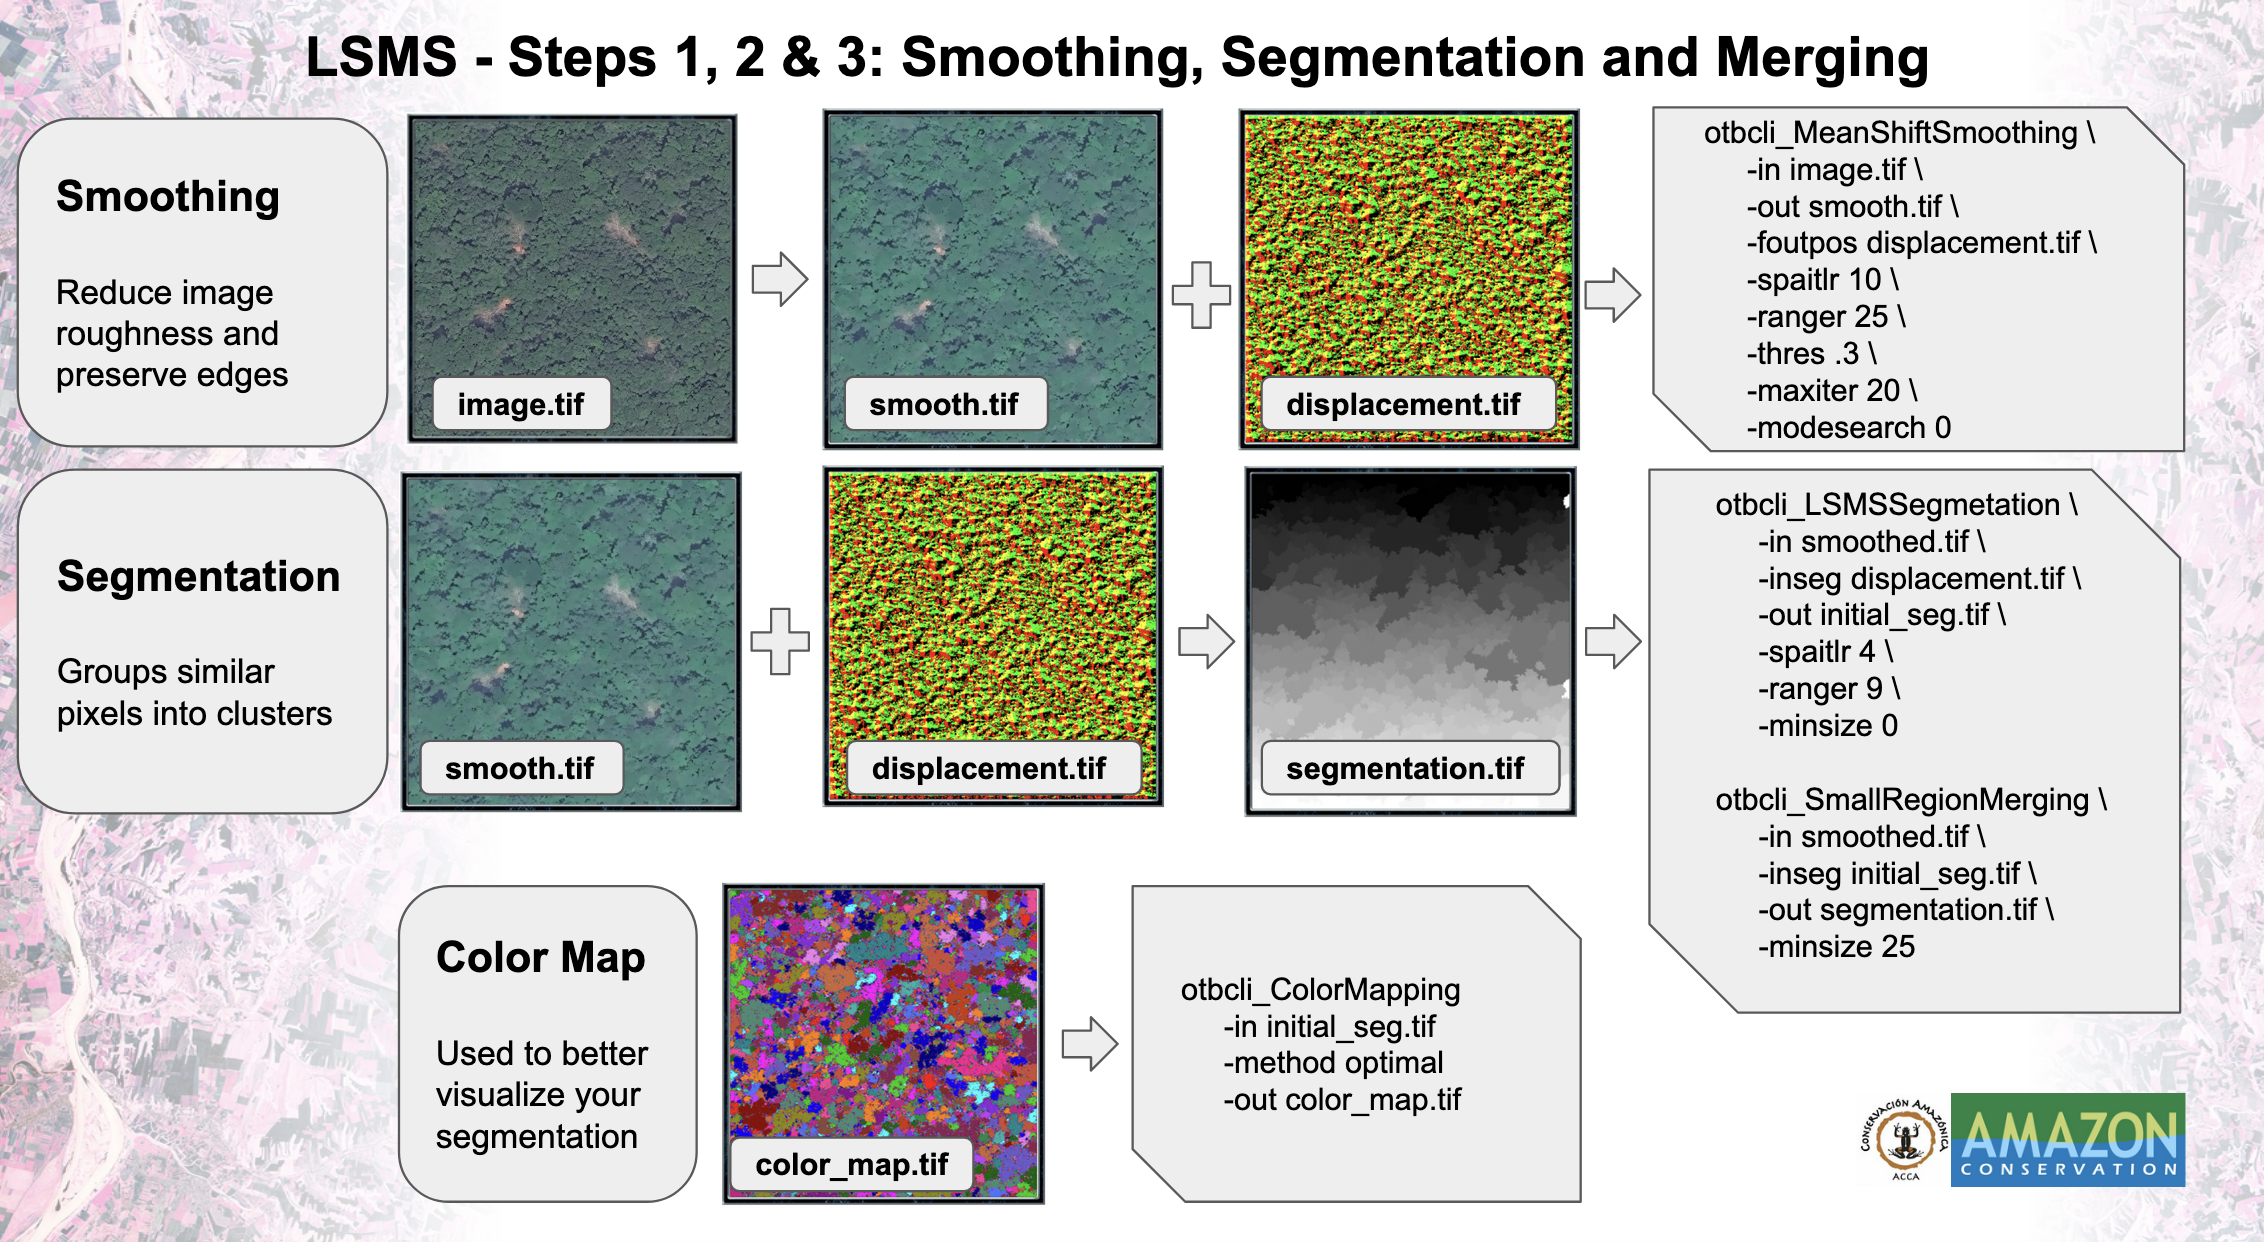
The program was designed for the intention to use High Resolution images and create an image segmentation using an unsupervised learning algorithm called Large Scale Mean Shift. The algorithm assigns each pixel in an image to what is called a “regional mean” and creates clusters of pixels that belong together according to this regional mean. The Large Scale Mean Shift workflow goes through 6 steps to eventually create a binary raster image based on the satellite image with the goal to create a binary raster showing forested parts of an image with black pixels and deforested parts of an image shown with no value (clear).

Steps 1, 2 and 3 are Smoothing, Segmentation and Small Regions Merging respectfully. The smoothing step creates two images a smoothed or otherwise blurry version if the input image and a displacement image that is somewhat abstract. These images are then fed to the segmentation algorithm that groups similar pixels into clusters based on the input values given to the algorithm as arguments. The resulting segmentation image is then given to the Small Regions Merging algorithm that merges clusters with a small amount of pixels to the nearest most similar cluster.
The fourth step is the Vectorization step where a vector file of the resulting clusters is created and the mean and variance of all pixels within each cluster are calculated and added the attribute table of the resulting shapefile.

The final steps are Rasterization and Binarizaation to eventually create the binary raster image we are looking for. The segmented vector file is rasterized and the resulting image is given to the Band Math function to create the final binary raster image. If a pixel value in the raster image is greater than a certain value it is given a value of 0 and if it is less than a certain value it is assigned a value of 256.

I also created some automated workflows where the flag values for all the algorithms are pulled from a text file allowing a user to add all the flag values to the text file and not be asked by the program to insert them along the way.

The MAAP project is also interested in tracking and monitoring illegal mining operations. Here I was able to create and automated workflow with geomundo that accurately separates out gold mines from the surrounding forested pixels. Below are two images from November to January 2019 showing the growth of an illegal gold mine in the Tambopata reserve.

Illegal mining operation in the Tambopata reserve in Peru
This image shows the growth of the mine over a two month period
I was able to set the parameters on Geomundo to create a binary raster file that has segmented out the mining operations from the surrounding forest and ran the automated workflow one time for both dates. Before and after binary raster images are created showing the size of the mine in November and January respectively. Then a difference image is then created using geomundo and Band Math algorithm to show areas where the mining operation has grown in that time.

Gemundo also has the ability to create a raster file to segment out road construction in the Amazon. Here we use the following flag values to create binary images of road construction in the amazon.

The parameters I settled on for the detection of deforested pixels in images are show here below.

One drawback to remote sensing is that satellite images can be obscured by clouds. I created a cloud detection algorithm to mask parts of a satellite image that have no useful data due to cloud cover. Below is an example of the cloud detection algorithm. While it works best in images comprised mostly of forested and deforested sections it has some issue with false detections inside gold mining operations.

Showing a cloudy satellite image on the right and on the left a binary raster file showing clouds in black.
A basic overview of the geomundo process is outlined in the slide below. The script collects basic information about what folder of images to work on, image types, and where to put the resulting images and what process or workflows to use on the images. It passes this information to a function that runs every process that the user has picked or runs the designated automated process.

Working on Geomundo was a highly rewarding and educational experience. While I was responsible for the development of Geomundo, the project would not have been possible without the technical expertise and oversight of Lucio Villa at Conservación Amazónica as well as the open source tool Orfeo Toolbox.
You can see the Geomundo script here.